NeuroNexus turns NASA's sharpest Mars terrain into walking plans for future astronauts, and shows how sure every number is.
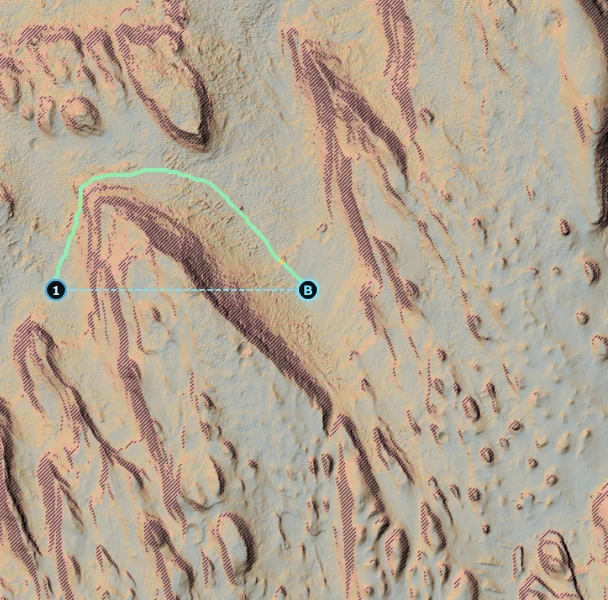
HiRISE 1 mMOLA 463 m
Drag or move across the card. Inside the lens: terrain at 1 m. Outside: the same ground averaged to the 463 m grid. Gale crater, the console's demo walk.
+Scroll to Explore+
Know the Ground Before You Walk It.
A True Story · Apollo 14 · February 1971
Thirty Meters Decided the Mission.
In February 1971, two Apollo 14 astronauts climbed toward the rim of Cone Crater. The terrain was rugged, their orbital maps were inadequate, and every ridge looked the same. They turned back. Orbital images later showed they had stopped just 30 meters from the rim. Hope is not a navigation strategy. With no GPS, up to a 22-minute one-way signal delay, and global dust storms, the first explorers on Mars cannot afford a 30-meter mistake.
The same resolution ladder now compares , and before an reaches its . The shows what coarse terrain hides.
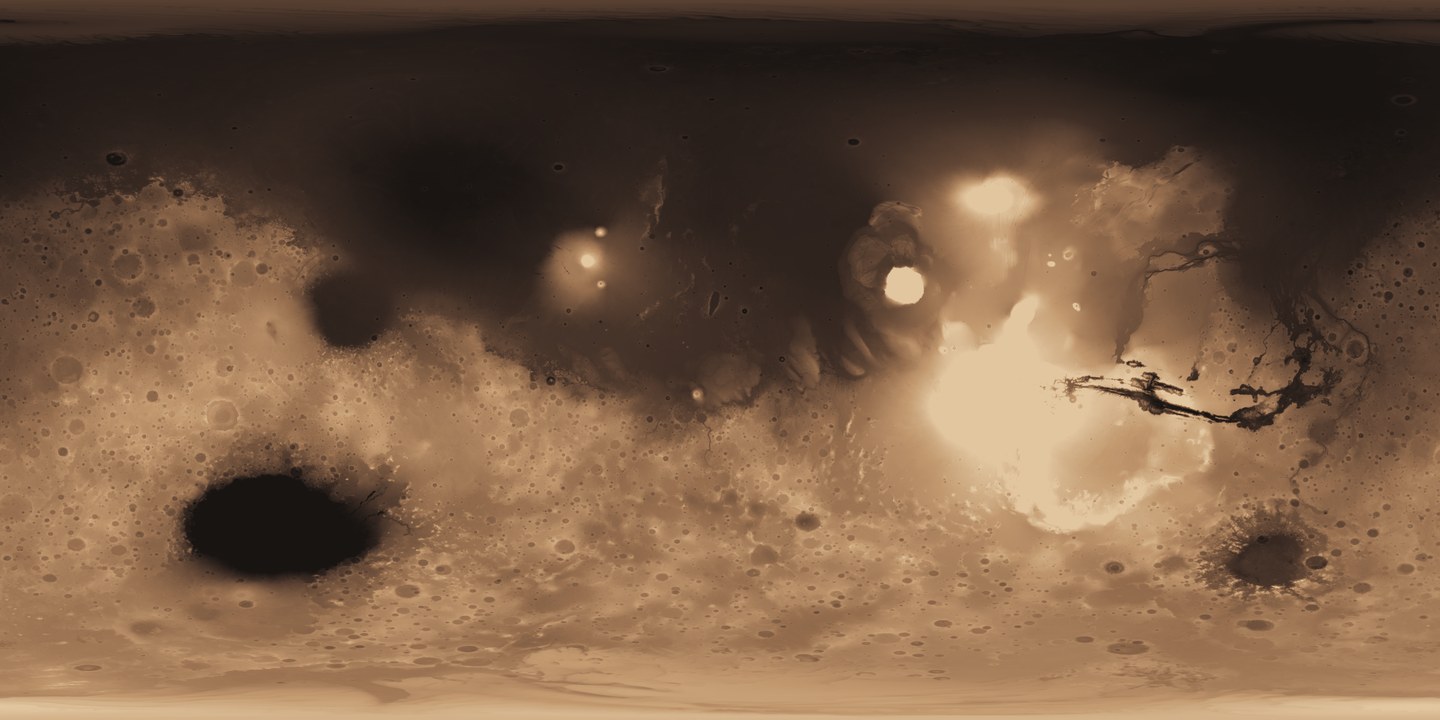
Gale crater, NASA MOLA 463 m, height exaggerated. Drag to turn.
Our Approach
Orbital maps blur the short, steep pitches a person would actually walk on. NeuroNexus stacks NASA's
, and
terrain, checks it against the tilt Curiosity and Perseverance really felt, and turns it into an
plan with a .
Every value carries its source. Missing data stays missing. Planning limits are labeled as planning limits, never as safety limits.
Three Scientific & Architectural Innovations
463 m underestimates p90 steep ground by x [1.70, 1.85]. A 1 m surface at a 3 m rover baseline reproduces felt tilt at x [0.89, 1.07].
01
Empirical Scale-Bias Calibration
Curiosity end-of-drive IMU tilt points prove the resolution ladder matters. V4 stayed within 10 m of JPL's human-planned drive 45% of the time versus 41% on MOLA-only, weaving around >15° scarps.
Multi-Objective Pareto Proof · Gale to Escalante (2,018 ms)
When the Shortest Line Is a Trap.
In 2,018 ms, deterministic multi-objective Dijkstra generates six candidates over NASA terrain and cataloged USGS, IAU and evidence. Five form the non-dominated frontier; the shortest path is mathematically dominated by the cubic .
Select a candidate to inspect its trade-off.
Candidate Route
Pareto Status
Distance
Total Climb
Est. EVA
Mean / Max Slope
Trade-Off Takeaway
1. Low distance
Dominated in this set
1,464.72 km
31,332 m
630.11 h
3.54° / 31.23°
94.3
The shortest-path trap: minimizing horizontal distance forces 31.3 km of vertical climbing and the highest risk proxy.
2. Low EVA
Pareto / non-dominated
1,465.20 km (+480 m)
22,597 m
623.74 h
3.05° / 32.90°
93.1
Walking just 480 meters farther (+0.03%) saves 8,735 meters of vertical climb and 6.37 hours of EVA time.
3. Low terrain-risk proxy
Pareto / non-dominated
1,510.34 km (+45.6 km)
21,416 m
639.83 h
2.07° / 28.07°
79.5
Trading +45.6 km (+3.1% distance) cuts 9,916 meters of climb and lowers the cubic slope and roughness risk proxy from 94.3 to 79.5.
4. Low terrain burden
Pareto / non-dominated
1,620.55 km
20,099 m
681.72 h
1.58° / 33.81°
82.1
Lowest total terrain burden (12.4 versus 23.9) and lowest cumulative climb, 11,233 m less than the shortest path.
5. Science first
Pareto / non-dominated
1,471.76 km
22,815 m
626.73 h
2.22° / 32.90°
85.9
Weighted 55% Science, 20% Terrain, 15% EVA and 10% Ops to maximize proximity to cataloged USGS, IAU and THEMIS evidence.
6. Balanced
Pareto / non-dominated
1,474.38 km
22,652 m
627.58 h
2.18° / 32.90°
85.9
Equal weights across all four normalized objectives. Score: 1.031.
Panorama: NASA/JPL-Caltech/MSSS · Curiosity Mastcam, sol 4,982 (Aug. 11, 2026), yardang layer on Mount Sharp · Source. Move the cursor to look around and wipe the dust.
Curiosity tilted on ground times steeper than the global
map shows. On 3 m
terrain the
is : the map matches what the rover felt.
The MOLA view of Gale. Drag to turn.
Gale, MOLA only
x
, n =
Gale, HiRISE 3 m
x
95% CI , n =
Jezero,
x to x
Same code, no retuning
Plans reproduced
Byte-identical on rerun
: from NASA MMGIS end-of-drive waypoints.
Validation run . Rovers drive, they do not walk, and rocks under 1 to 2 m are below the terrain models.
Read the full method
Where NASA Data Becomes a Walking Plan.
01
Planning Limits Are Not Safety Limits
Every status reads Within Planning Limits, Review Required or Exceeds Planning Limit. No route or ground receives a safety verdict.
02
No Hallucinated Values
Where NASA data does not reach, the console says n/a or Unavailable. A gap is shown as a gap, never filled with a guess.
03
AI May Explain, Never Invent
A deterministic engine owns every route and number. answers through and labels each answer as AI interpretation.
NASA Space Apps Challenge 2026
Interplanetary Survival Guide: Martian Map
The Challenge Asks ForNeuroNexus Answers WithNASA Data
the best map possible
Terrain resolution ladder; synchronized 2D, USGS geology and 3D maps.
HiRISE, CTX, MOLA; USGS SIM 3292; IAU Gazetteer
details of their routes and destinations
MARSWALK planner, Route Design, multi-stop EVAs, comparison, EVA brief and exports.
MOLA, HiRISE, CTX; MMGIS rover traverses
updates on current conditions
One active sol drives modeled dust, archived RAD dose, rover weather, THEMIS history and live close approaches, each labeled.
NASA Ames Mars GCM, MSL RAD, REMS, MEDA, THEMIS, JPL CAD
the data necessary to make informed and scientifically meaningful decisions
Planning statuses with plain reasons, sensitivity, site science and evidence classes. NeuroNexus shows the data behind each decision and never labels ground safe.
All of the above, with a source tag on every value
Built on Open Data From
NASA MOLA, MRO HiRISE and CTX, Mars Odyssey THEMIS, MSL RAD and REMS, Mars 2020 MEDA, NASA Ames Mars GCM, NASA MMGIS rover traverses,
NASA/JPL Close-Approach Data, NASA Image and Video Library, USGS Astrogeology and the IAU Gazetteer, USGS SIM 3292, ESA Mars Express, Esri ArcGIS Mars services.
See how each one is used